A storm simulation can be run from Site3D using the storm simulation tool . After you have ran a storm simulation you can then see the simulation report.
Simulation Results Report
The simulation results window is shown after running a storm simulation on a drainage network.
The results are then stored in the network so you can safely close the results display and return to it later as long as the network remains unmodified.
Note: Changes made to the drainage network will invalidate any previously calculated simulation results for the modified network because the simulated network will no longer match the drainage network in the model.
In this situation the drainage simulations should be re-run for the modified network.
To see a previously calculated simulation results report you can press the  Simulation Results Report button on the
  Drainage Analysis toolbar and select the network on the Plan View.
Document Header Details
At the top of each page of the simulation results you have the report header. On the top right it shows the company name, the name of the person who ran the simulation and the date when the results were generated.
In the centre underneath the "Drainage Simulation Results" title it shows the name of the project.

You can customise the header information and how the simulation results report is displayed using the Simulation Results Report Properties.
Drainage Network Details
On the first page of the results you have the network details which lists the following items that were included in the simulated network:
- Manholes
- Conduits
- Permeable Paving
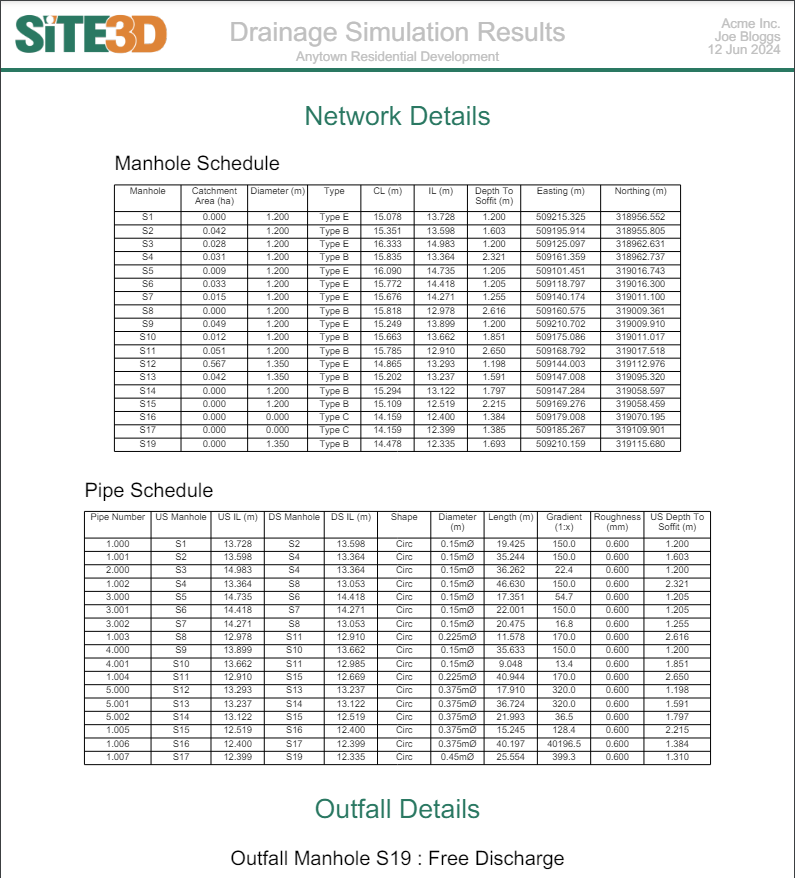
Manhole Schedule Columns
- Manhole: Name of the manhole.
- Catchment Area: 2D area of ground where rainfall will flow directly into this manhole.
- Size: Circular diameter or rectangular width and length describing the plan shape of this manhole.
- Type: SFA/DCG type of this manhole.
- CL: Cover Level at the top of the manhole.
- IL: Invert Level at the bottom of the manhole.
- Depth to Soffit: Level difference between the cover level and the soffit of the outgoing conduit of this manhole.
- Easting: X-axis part of the manhole's coordinate.
- Northing: Y-axis part of the manhole's coordinate.
Pipe Schedule Columns
- Pipe Number: Name of the conduit.
- US Manhole: Name of the upstream manhole.
- US IL: Invert Level of this conduit at the upstream manhole end.
- DS Manhole: Name of the downstream manhole.
- DS IL: Invert Level of this conduit at the downstream manhole end.
- Shape: Cross sectional shape of this conduit, eg circular, rectangular, trapezoidal, etc.
- Diameter: Cross sectional diameter of this conduit if circular or otherwise width and height.
- Length: 2D length of this conduit measured from the centre of manholes at either end.
- Gradient: Longsectional gradient of this conduit.
- Roughness: Colebrook-White roughness factor of this conduit.
- US Depth to Soffit: Level difference between the upstream manhole's cover level and this conduit's soffit level at the upstream manhole.
- DS Depth to Soffit: Level difference between the downstream manhole's cover level and this conduit's soffit level at the downstream manhole.
Permeable Paving Schedule Columns
- Permeable Paving: Name of the permeable paving area.
- Assigned Manhole: Name of the manhole that the outfall connects to.
- Effective Storage Volume: Water storing volume in the Storage layer, taking into account the porosity.
- CL: Cover level of the assigned manhole.
- IL: Level at the base of the Storage layer.
- Storage Infil Rate: Infiltration rate into the ground under the storage layer.
- Safety Factor: Factor applied to the infiltration rate to account for siltation.
- Easting: X-axis part of the annotation position within the area.
- Northing: Y-axis part of the annotation position within the area.
Note: If the manhole is assigned to a pond/tank it will instead use the pond/tank invert level, cover level and freeboard settings. Furthermore, if it is assigned to a tank with a freeboard of 0m then it will not report flood risk when the water head is above the top level of the tank, but will instead report surcharged.
Outfall Details
Below the schedules is outfall details showing which node is the designated outfall and whether it is a Free Discharge, Surcharged, Infiltration Pond or Infiltration Tank.
Flow Controls
After the outfall details are a list of the flow controls included in the network showing the relevant details of each control used.

Weirs
- Invert Offset: Height of weir wall above manhole invert level.
- Weir Width: Width of weir over which water can flow.
- Discharge Coeff: Discharge coefficient (unitless).
Flap Valves and Orifices
- Invert Offset: Height of orifice invert level above manhole invert level.
- Orifice Diameter: Cross sectional diameter of orifice opening.
- Discharge Coeff: Discharge coefficient (unitless).
Vortex Flow Controls
For example, ACO Q-Brake, Stormbrake, Hydro-Brake® Optimum
- Model Ref: Manufacturers reference ID for the specific device.
- Design Depth: Maximum expected depth of water (head) above the invert of the flow control.
- Design Flow: Desired maximum discharge rate used in the design and specification of this device.
- Invert Offset: Height of vortex flow control's invert level above manhole invert level.
- FF Head: (Flush Flow Head) Head of fluid at the point where the vortex flow control transforms from standard flow to vortex flow.
- FF Flow: (Flush Flow) Flow rate of fluid at the point where the vortex flow control transforms from standard flow to vortex flow.
- KF Head: (Kickback Head) Head of fluid at the point where the vortex flow control produces a steady vortex.
- KF Flow: (Kickback Flow) Flow rate of fluid at the point where the vortex flow control produces a steady vortex.
Pumps and Depth/Flows
- Invert Offset: Height of flow control's invert level above manhole invert level.
- Depth and Flow: List of sequential pairs of values that describe the flow rate at a specific depth for this device.
Pond and Tank information
Any ponds and tanks that are in the network are listed out next with a table for each showing the properties like Invert Levels, Max Depth etc. Underneath this table is a pictorial depth area diagram for the simulated pond structure that also includes the max water level achieved in the simulation annotated with the critical storm for each return period.
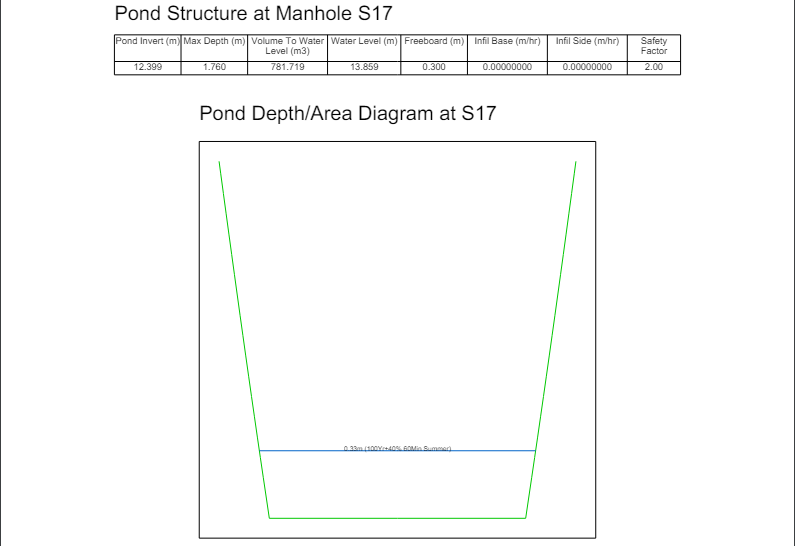
Pond and Tank Columns
- Pond/Tank Invert: Lowest Z elevation of the pond or tank structure that stores water.
- Max Depth: Difference in level between highest possible water level and invert level.
- Volume to Water Level: Volume of water in the pond/tank at the freeboard water level.
- Water Level: Maximum water level at freeboard.
- Freeboard: Vertical distance above the water level to the maximum possible water level.
- Infil Base: Infiltration Rate on the base of the structure.
- Infil Side: Infiltration Rate on the side of the structure.
- Safety Factor: Safety Factor that is applied to the base and side infiltration rates.
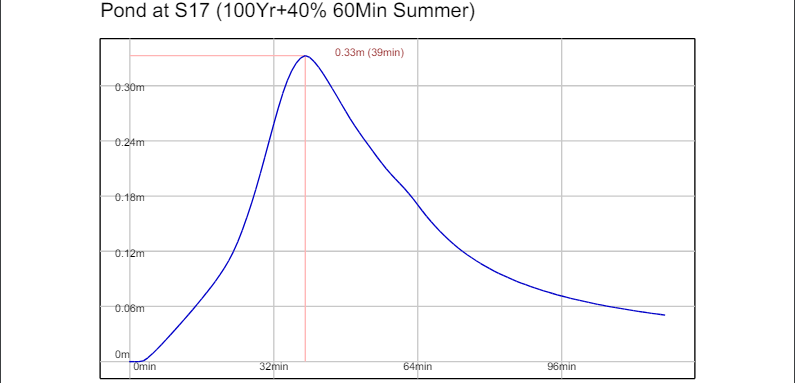
Draindown Graph
For each of the ponds and tanks you will also get a graph showing the water level over the course of the simulation. The peak is indicated with an annotation for the level and time. From the peak you have the drain down to the end of the simulation which can be used to calculate the half drain down time:
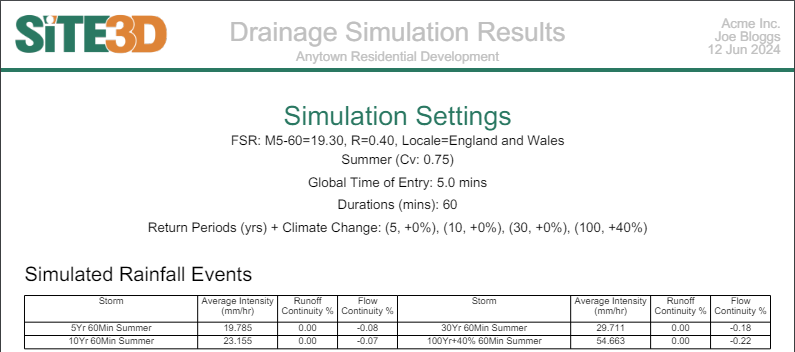
Simulation Settings
After the pond and tank information is the simulation settings.
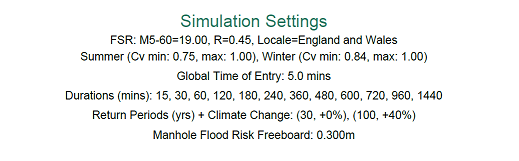
- Rainfall type (FSR, FEH) used in the simulation with any relevant settings.
- Rainfall locale (England and Wales, Scotland) used in the simulation.
- Rainfall profiles used (Summer, Winter) and their Cv values used in the simulation.
- Global Time of Entry for drainage features that are set to use the Global value.
- List of Storm Durations simulated.
- List of Storm Return Periods simulated along with their Climate Change values displayed in pairs (Return Period, Climate Change %).
Additional Storage / MADD Factor
As a result of discussions with LLFAs (Lead Local Flood Authorities), Site3D does not include a setting for additional storage per hectare or MADD Factor. Accordingly, the drainage simulation is done with 0.0m³/ha additional storage and a MADD Factor of zero.
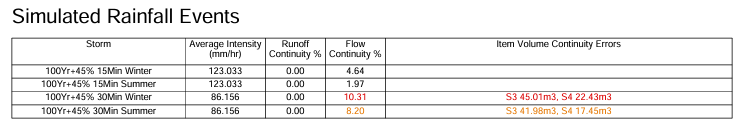
Simulated Rainfall Events
The Simulated Rainfall Events table lists out all storms simulated showing which Return Period, Duration and Season information with the calculated Rainfall Average Intensity and also any potential continuity errors.
Continuity Errors
Continuity errors in a drainage system simulation are used to assess the accuracy of the model's results and are an indication of flow stability through the network. Continuity Errors are reported as two separate percentage values, each representing the difference between input and output for different system components and should ideally be as close to zero as possible.
- Flow Continuity Error: Reflects the accuracy of simulation through the system’s manholes, conduits, tanks and ponds.
- Runoff Continuity Error: Reflects the accuracy of the simulation across any modeled drainable areas.
A positive continuity error indicates a higher inflow than outflow i.e. unexpected water loss, whereas a negative value indicates a higher outflow than inflow i.e. unexpected water gain. The equation used for continuity errors is:
Continuity Error = 100 * (1 - Total Outflow / Total Inflow)
Continuity Error Severity Levels
The continuity errors are classified and coloured based on their severity as follows:
- 0-5%: Acceptable level of accuracy (black).
- 5-10%: Less accurate but still within acceptable tolerance (orange).
- >10%: Unreliable for realistic simulations (red).
Common Causes of High Continuity Errors
- Short pipe sections.
- Extreme flow control values in manholes.
By reviewing these continuity errors, the overall reliability of the simulation can be determined and potential issues in the system design can be identified. You can further inspect the errors by turning on per item continuity errors in the Simulation Results Properties window, this adds an additional row to the Simulated Rainfall Events table showing item continuity errors for the simulated storm.
Simulation Results
The final section shows the simulation results for each return period. Each Return period will show a table of the simulation results for Manholes, Conduits and permeable paving.
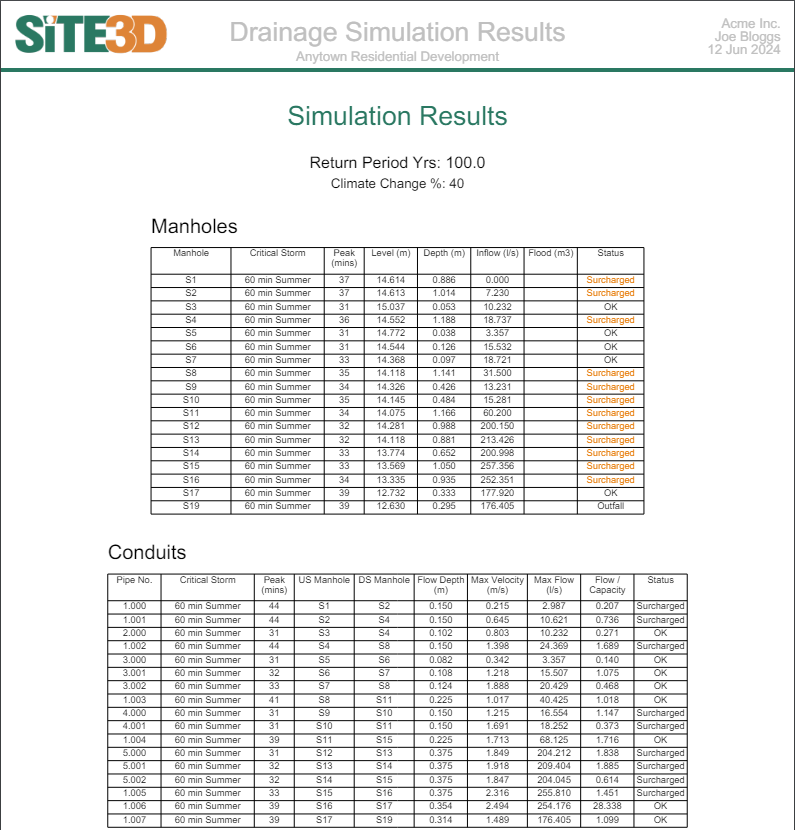
Manhole Table Columns
- Manhole: Name of the manhole.
- Critical Storm: The storm which resulted in this manhole having either the most amount of flooding or the highest depth of water for the return period.
- Peak: Time in minutes from the beginning of the storm when the peak flooding or peak water depth occurred for this manhole.
- Level: Z Elevation of water level at the peak minute of the critical storm.
- Depth: Water depth in this manhole at the peak minute of the critical storm.
- Inflow: Rate of water flowing into this manhole at the peak minute of the critical storm.
- Flood: Total volume of water lost to flooding from this manhole in the critical storm. Blank if no flooding.
- Status: Summary the state of the manhole, pond, tank or permeable paving (OK, Surcharged, Flood Risk, Flood, Outfall)
Status Description for Manholes
- Outfall: The manhole is the assigned outfall of the system.
- OK: The maximum water level is lower than the outgoing pipe soffit.
- Surcharged (orange): The water level is higher than the outgoing pipe soffit, but lower than the freeboard level.
- Flood Risk (orange): The water level is above the freeboard level of the manhole but below the cover level.
- Flood (red): The water level exceeds the cover level of the manhole resulting in flooding.
Conduit Table Columns
- Pipe No.: Name of the conduit
- Critical Storm: Name of storm which resulted in this conduit having the highest flow depth for the return period or the highest flow rate if surcharged.
- Peak: Time in minutes from the beginning of the storm when the peak flow depth was achieved for this conduit.
- US Manhole: Name of upstream manhole.
- DS Manhole: Name of downstream manhole.
- Flow Depth: Depth of flow in this conduit at the peak minute of the critical storm.
- Max Velocity: Highest velocity of water flowing through this conduit for any storm in the return period.
- Max Flow: Highest flow rate of water flowing through this conduit for any storm in the return period.
- Flow/Capacity: Max Flow as a ratio of the maximum capacity when flowing only under gravity. This value can be more than 1 if flowing under pressure in surcharged situations.
- Status: Summary the state of the conduit (OK, Surcharged).
Conduit Status Description
- OK: The water level is lower than the conduit soffit.
- Surcharged (orange): The conduit is fully submerged
Status Description for Permeable Paving
Below are the status options for permeable paving. Permeable paving is built up of a storage layer, a bedding layer, and a pavement layer.
- OK: The permeable paving water level is within the storage layer.
- Surcharged (orange): The water level is above the storage layer but within the bedding layer.
- Flood Risk (orange): The water level is above the bedding layer but within the pavement layer.
- Flooded (red): The water level is above the cover level of the paving.
- Runoff (red): Water has runoff the surface without entering the paving.
Note: Runoff is only reported if water overflows the kerb height without infiltrating into the pavement layer.
Simulation Results Report Properties
You can access the storm simulation report properties by pressing the  button on the Drainage Analysis toolbar. You will see the following window appear:

Report Header Information
Here you can customize the information shown in the header at the top of every page.
Network Details
When the Network Details option is ticked you will see the manhole and pipe schedule at the top of the report.
Item Continuity Errors
When the Item Continuity Errors option is ticked the highest item continuity errors will be displayed next to each storms total error. See Continuity Errors for more information.
Flood Risk Freeboard
If the water level in a manhole goes above this depth below cover level in the drainage simulation, this manhole will be annotated as "Flood Risk" in the simulation results.
The Freeboard of other design items like ponds and tanks is configurable in the Pond and Tank properties windows. The Freeboard for Ponds and Tanks will also be shown per item in this report in the Pond and Tank details.
See Also: